Structure of the UK Construction Industry – August 2012
August 29, 2012 Leave a comment
It’s been a while since my last post- I have been wholly consumed with work and other obligatory life commitments, but a poor show none the less. So as some kind of recompense, I thought I would take a look at some of the most recently published ONS construction data in some detail and upload some interesting charts.
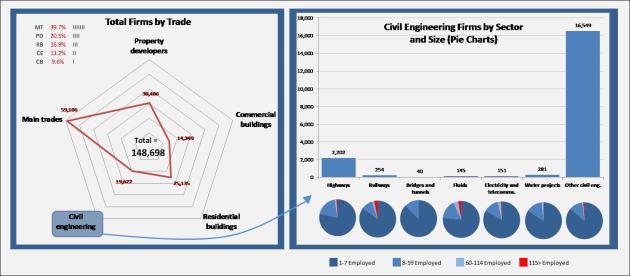
The rather messy charts below (click on it to enlarge) represent data from the ONS Construction Statistics No. 13, 2012 Edition published 24th August 2012. Let’s start by looking at a snapshot of our industry constituents – total firms by trade and civil engineering firms (the field I work in most) in more detail…..
It would be interesting to visualise how the industry has changed shape over the years but having read some of the background information, it would seem that any shift would merely represent changes in the registers (the Builders Address File (BAF) pre 2010 and the Inter-Departmental Business Register (IDBR) from 2010). It should also be noted that the size of firms will not be entirely accurate – ‘firms’ are recognised as ‘reporting units’ so larger companies may report through a plethora of separate operating companies/regional units/divisions/etc.
The moral of the story…..don’t take all data and statistics at face value, especially summary headlines – context is everything.
Next post I’ll do a summary of the most useful construction industry indicators that I personally use on a monthly basis. Something to look forward to right?! I will try to provide some more interesting visualisations too!

